Leaving Throughput on the Table: A Diagnostic Look at Why Sintering Facilities Routinely Underperform Their Own Nameplate Ratings
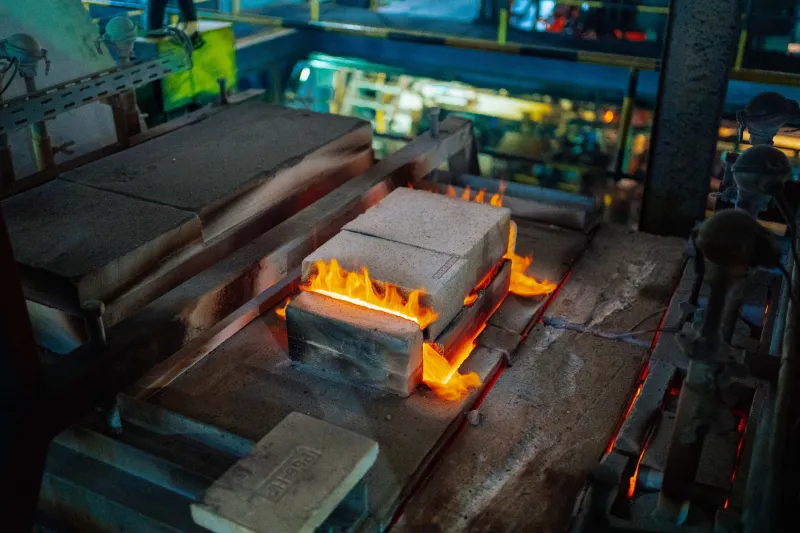
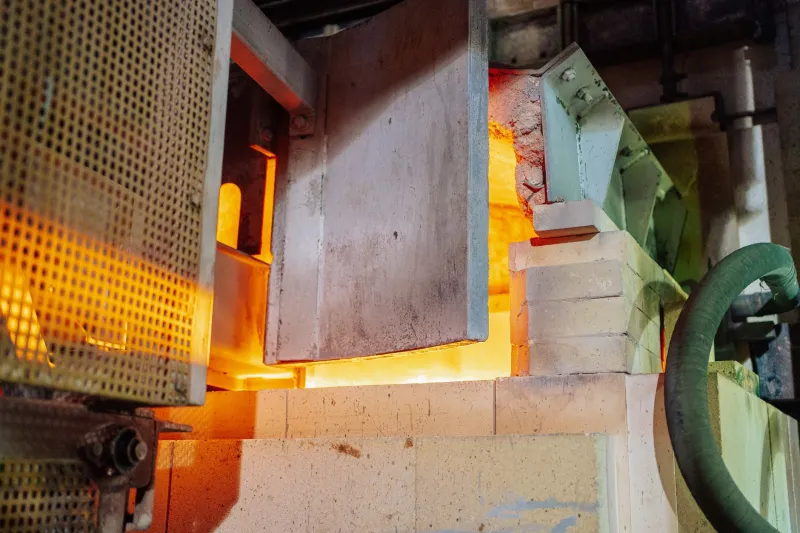
Walk the floor of almost any sintering facility in the United States and you will find equipment that was engineered for considerably more than it is currently asked to do. Furnaces sized for continuous high-volume production sit idle during shift transitions. Powder handling systems cycle at a fraction of their rated throughput. Quality inspection checkpoints bottleneck material flow in ways that no one ever formally measured. The result, according to process consultants and plant engineers who spoke with SinterCom, is an industry operating at an estimated 55 to 65 percent of theoretical capacity—not as an occasional shortfall, but as a persistent, normalized condition.
The consequences extend well beyond lost revenue. Underutilization inflates per-unit energy costs, distorts maintenance scheduling, and creates a misleading picture of what additional capital investment might actually accomplish. Before a plant manager can make a credible case for new equipment, it is worth asking a harder question: is the existing equipment being used well?
The Nameplate Problem
Nameplate capacity figures are engineering ideals. They describe what a furnace, press, or powder feed system can sustain under optimal conditions—consistent feedstock quality, uninterrupted operation, calibrated process parameters, and a fully staffed, experienced crew. In practice, none of those conditions hold simultaneously for extended periods.
The gap between nameplate and actual output is sometimes called the "capacity shadow," and it is rarely uniform across a facility. One section of a production line may be running at 90 percent efficiency while an adjacent station operates at 40 percent, creating a systemic constraint that drags average throughput down without triggering any single, obvious alarm. This is precisely what makes the problem difficult to address through conventional performance reviews—the underperformance is distributed, not concentrated.
Process engineers at several mid-sized Midwestern sintering operations described a common pattern: throughput losses accumulate in three-to-five-minute increments across dozens of daily micro-events—a delayed powder charge, a manual quality hold, a furnace temperature excursion requiring a brief cycle pause—none of which individually registers as significant, but which collectively represent hours of lost production per week.
Sequencing Inefficiencies: The Invisible Bottleneck
Among the most underappreciated contributors to capacity loss is poor process sequencing. Sintering is inherently a staged operation—compaction, thermal processing, and post-sinter finishing must be coordinated with precision. When upstream and downstream stages are not synchronized, buffer zones fill, lines stall, and furnaces wait.
In facilities where production scheduling is still managed through manual methods or legacy ERP systems not specifically designed for thermal processing workflows, sequencing errors are endemic. A furnace running a long thermal cycle for a specialized alloy part may hold up a line that could otherwise be processing standard components. Without real-time visibility into queue depth and cycle status, supervisors make conservative decisions—slowing intake rates to avoid downstream jams—that protect quality but quietly sacrifice volume.
Some facilities have begun piloting discrete-event simulation tools to model their production flow before committing to scheduling changes. These tools, borrowed largely from automotive and aerospace manufacturing, allow plant managers to stress-test sequencing decisions against historical cycle time data without disrupting live production. Early adopters report identifying throughput improvements of 12 to 18 percent through sequencing adjustments alone—no new capital required.
Quality Control Checkpoints: Necessary, But Not Neutral
Quality assurance is non-negotiable in sintered component manufacturing. Dimensional tolerances, density uniformity, and surface integrity requirements are strict, and the cost of a nonconforming part reaching a downstream customer in industries like automotive or medical devices is severe. But the placement and frequency of quality control checkpoints within a production flow carries a throughput cost that many facilities have never formally quantified.
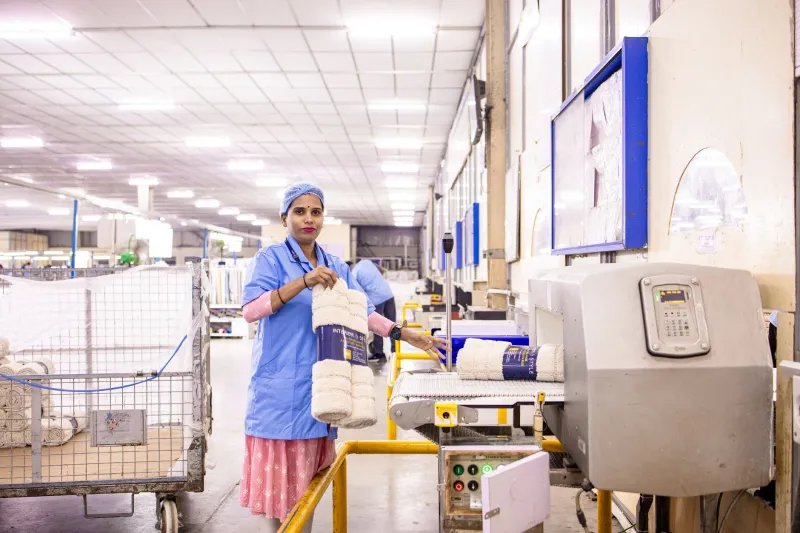
In several operations surveyed informally for this article, quality holds—moments when production pauses pending inspection results or supervisor sign-off—accounted for between 8 and 14 percent of total available production time. Some of those holds were genuinely necessary. Others reflected inspection protocols that had not been revisited since the facility was first commissioned, designed for material specifications or customer requirements that had since changed.
A more rigorous approach involves mapping every inspection touchpoint against actual defect catch rates. If a checkpoint consistently clears product without finding issues, it warrants review—not necessarily elimination, but potentially redesign as an inline, non-interrupting measurement rather than a stop-and-inspect event. Statistical process control tools, already widely used in aerospace sintering applications, offer a pathway toward continuous monitoring that preserves quality assurance without imposing the same throughput penalty as periodic manual holds.
Equipment Utilization: The Numbers Nobody Wants to Share
Ask a plant manager for their overall equipment effectiveness (OEE) score and the response is often cautious. OEE—a composite measure of availability, performance, and quality rate—is a revealing metric precisely because it is unforgiving. Industry benchmarks for sintering operations suggest that world-class OEE sits around 85 percent. Most facilities, when they measure honestly, find themselves in the 55-to-70-percent range.
The availability component is frequently where the most ground is lost. Unplanned downtime for furnace element replacement, thermocouple calibration, or atmosphere control system failures compounds with planned maintenance windows to reduce the hours a furnace is actually producing. In facilities where preventive maintenance schedules have drifted—often because of workforce constraints—unplanned stoppages become more frequent, further eroding availability.
Performance losses, the second OEE component, often trace back to reduced cycle speeds adopted informally to manage process variability. When operators have learned through experience that running a furnace at 95 percent of its rated belt speed produces marginal parts, they slow it down—a reasonable field adaptation that never gets formally documented or revisited when the underlying cause of the variability is eventually resolved.
The Operator Experience Variable
No diagnostic of sintering capacity is complete without an honest accounting of operator expertise. Sintering is not a process that responds well to generic manufacturing knowledge; it requires familiarity with thermal profiles, atmosphere chemistry, powder behavior, and the subtle sensory indicators—color, sound, smell—that experienced operators use to catch problems before instruments register them.
In facilities where experienced sintering personnel have retired or moved on without adequate knowledge transfer, newer operators tend toward conservative process settings. They run lower temperatures, wider safety margins, and more frequent holds—all of which protect against catastrophic failures but systematically suppress throughput. The result is a facility that functions, but functions well below what its equipment and process design would otherwise support.
Addressing this dimension of the capacity problem requires investment in structured knowledge transfer, mentorship programs, and operator-level process education—topics that SinterCom has examined in depth elsewhere. But from a pure throughput perspective, the point is straightforward: equipment cannot outperform the people operating it.
A Diagnostic Starting Point
For plant managers who suspect their facility is underperforming but lack a clear starting point, the following sequence offers a practical entry into the diagnostic process. Begin with a time-loss audit—a structured log of every production interruption over a two-week period, categorized by type and duration. This exercise alone frequently surfaces patterns that are invisible in aggregate performance reports.
Follow the time-loss audit with a sequencing review, mapping material flow from powder intake through final inspection to identify queue accumulation points. Then conduct an OEE calculation by production line segment, not just for the facility as a whole—aggregate figures mask the localized constraints that drive system-wide underperformance.
None of this requires capital expenditure. It requires time, rigor, and a willingness to examine operations without defensiveness. The capacity is already there. The question is whether it will be recovered.